Viewing Execution Results |
  
|
Viewing Execution Results |
|
To see the results of each decision's execution:
Look at the text in the decision node in the Document Builder pane. The value you entered when building your document (see Building an Input file) may have changed due to the execution of a formula that is associated with it.
You can also see the results of your test by holding your mouse cursor over the decision - the result will appear next to `Execution Result'.
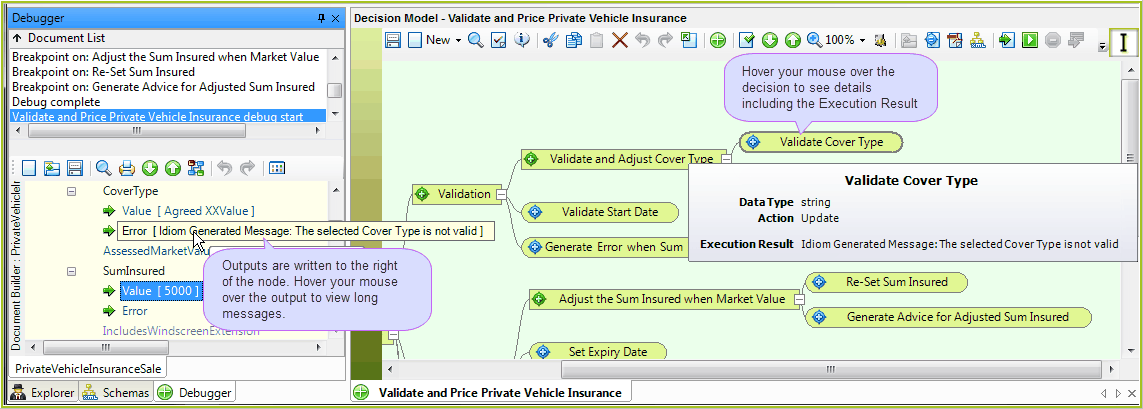
Figure 3-37(d): Decision Execution Result
Click the Show execution timings stopwatch button on the toolbar after the model has executed to view the decision (group) execution timings. These timings are displayed in milliseconds and as a percentages of the timings of their parent decision group. These timings are indicative only but they can be used to determine which collections and formulas have used the most resources. An example where this can be useful is to determine that a Use Previous Context flag was not set which lead to independent instead of linked iterations through multiple collections, see Previous Context.
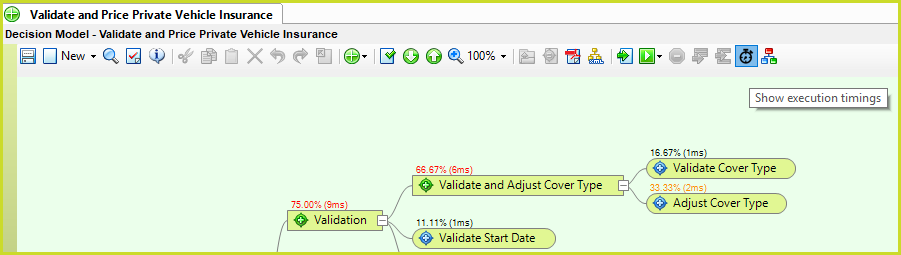
Figure 3-37(d): Decision Execution Result
Execution count
Point the mouse at a decision or group after execution and its pop up will display the Execution Result, Execution time and Execution count.
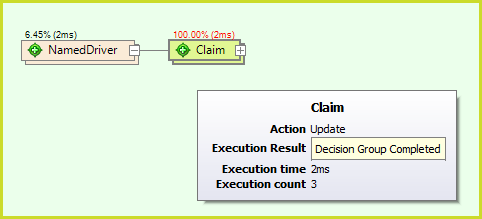
Figure 3-37(e): Decision pop up's Execution Result, time and count