Specifying a Break Point |
  
|
Specifying a Break Point |
|
When conducting an in-line test, you can test the entire decision model or you can specify where you want the test to halt, by assigning a break point at the point that you wish to inspect.
STEPS
1. |
Open the debugger by clicking on the test inputs button |
2. |
Right-click on the decision you wish to inspect. |
3. |
Select Debug > Insert Break Point. |
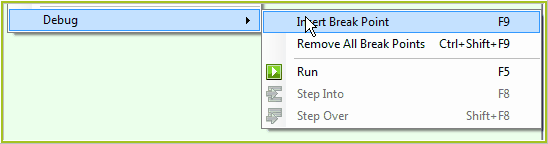
Figure 3-39(a): right-click on a decision/group and select Debug > Breakpoint
The selected decision/group will turn blue.
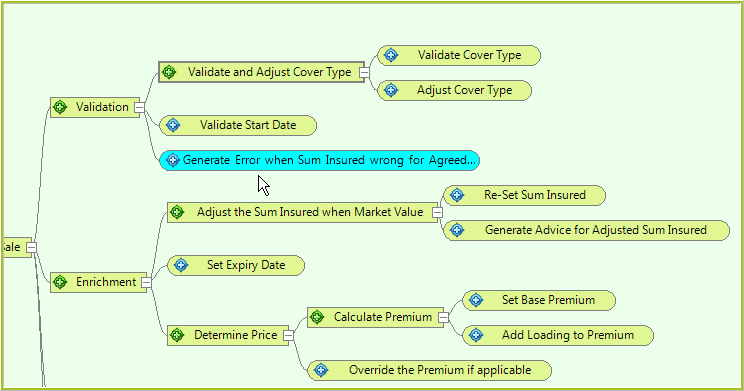
Figure 3-39(b): A Break Point in the decision model
4. |
Click on the Run button |
IDIOM will now process every decision up to, but not including the specified Break Point;
•the decision at the break point will turn yellow
•the document builder pane will turn grey
•the context node for the decision/group at the break point will turn yellow in the document builder
You can now review the decision results for all of the decisions run up to, but not including the break point. Look at the text in the nodes in the Document Builder pane or hold your mouse over a decisions to view the results.
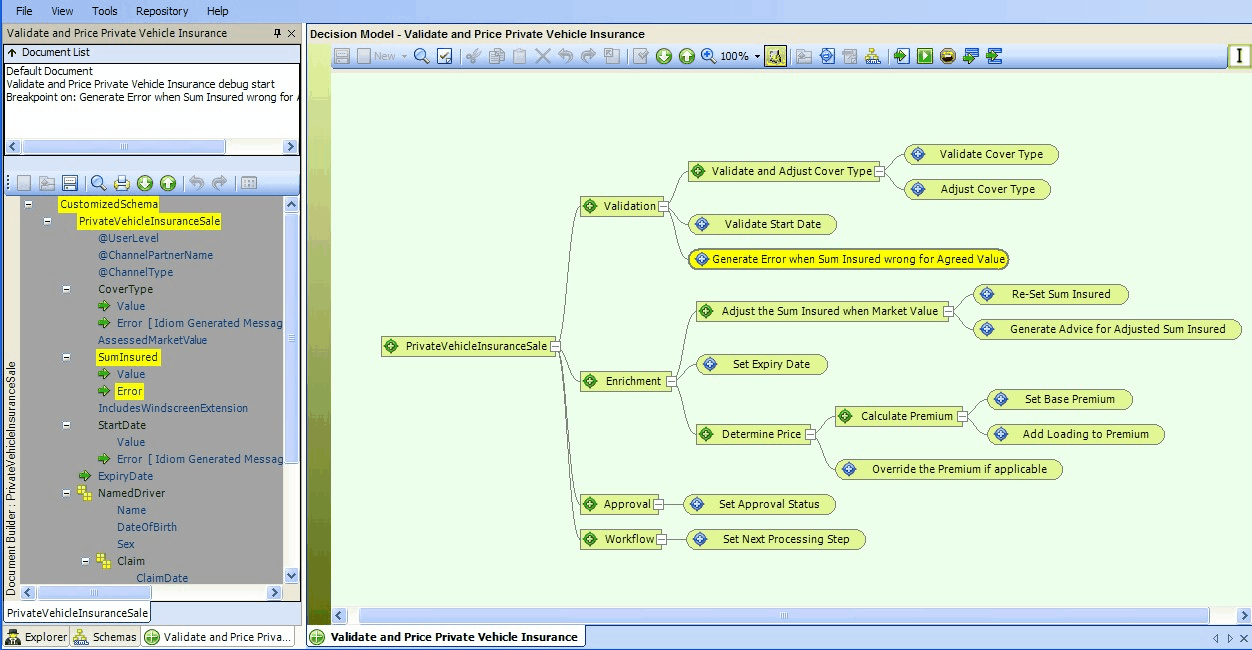
Figure 3-39(c): The nodes associated with the debugging activities as well as the parent nodes are highlighted in the Document Builder pane.
5. |
Click on the Run button |
If no further break points are inserted, the debugger test will complete, the document builder will return to its normal colour with a yellow background, and the decision with the break point inserted will return to blue.
Tip |
To remove a Break Point, right-click on the blue decision and select Debug | Remove Break Point and then click on the Run button. |
 in the decision model toolbar, and prepare an inline test for the Validate and Price Private Vehicle Insurance decision model. (see
 .